Typo, *Xymon 4.3.30 <http://xymon.sourceforge.net/> *(but have the same issue in both versions)
On Sat, Jan 25, 2025 at 2:26 PM Ken Connell <kconnell@torontomu.ca> wrote:
Trying to graph temperature, it's a single OID that is polled successfully, but graph data notes the changes and separate values instead of graphing the changes as a whole.
*Xymon 4.3.28 <http://xymon.sourceforge.net/> with Devmon * 0.3.1-beta1 (I am working on the newer Devmon version, but haven't gotten far enough with that version to implement yet).
For RRD data - I get multiple files for the host/test:
temperature.CPU:_44.rrd
temperature.CPU:_45.rrd
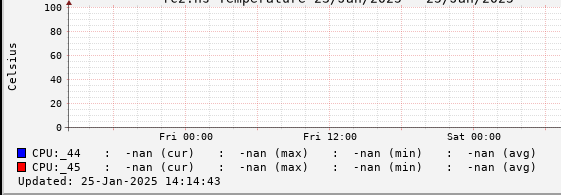
Snip from graphs.cfg (only thing I changed is the scale): [temperature] FNPATTERN ^temperature.(.+).rrd TITLE Temperature YAXIS Celsius *-u 100 <-- only change* DEF:p@RRDIDX@=@RRDFN@:temperature:AVERAGE LINE2:p@RRDIDX@#@COLOR@:@RRDPARAM@ GPRINT:p@RRDIDX@:LAST: \: %5.1lf (cur) GPRINT:p@RRDIDX@:MAX: \: %5.1lf (max) GPRINT:p@RRDIDX@:MIN: \: %5.1lf (min) GPRINT:p@RRDIDX@:AVERAGE: \: %5.1lf (avg)\n
What am I missing here?
[image: image.png]
--
Ken Connell Senior Network Engineer Computer & Communication Services Toronto Metropolitan University (Formerly Ryerson University) 350 Victoria St RM PODB50 Toronto, Ont M5B 2K3 416-979-5000 x556709
--
Ken Connell Senior Network Engineer Computer & Communication Services Toronto Metropolitan University (Formerly Ryerson University) 350 Victoria St RM PODB50 Toronto, Ont M5B 2K3 416-979-5000 x556709